
XRA RF Input Power Levels
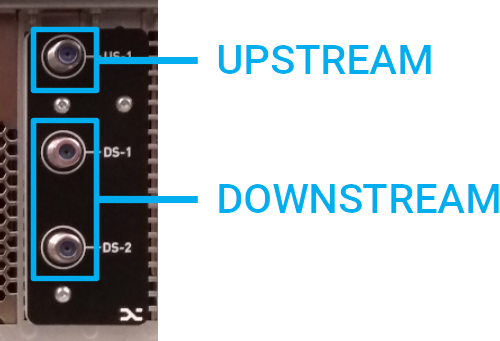
| Introduction | This document discusses the recommended power levels at the XRA RF input ports for optimal operation. The XRA provides two downstream and 1 upstream RF input ports (75 Ω).
|
| Downstream | Automatic gain control of the XRA ensures that downstream channel power levels stay within their optimal bounds at different stages of the internal processing chain (analog ADC input, digital FPGA input). The employed full-band-capture technology implies that the total RF input power (and not the individual channel power) is the relevant metric for downstream. In general, the following rule applies: A downstream RF input signal with total input power between 30 dBmV (-19 dBm) and 51 dBmV (2 dBm) is considered optimal. If the above condition is not satisfied, the XRA generates a warning (for small deviations) or error message (for large deviations) in the corresponding connector state, along with a recommendation to help you remedy the situation.
Notes
|
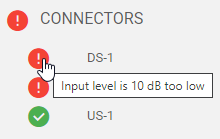
| Upstream | Also, here automatic gain control regulates the internal upstream power levels. In general, the following rule applies: An upstream RF input signal with average upstream channel power density between 7 dBmV/1.6 MHz and 28 dBmV/1.6 MHz is considered optimal. If the above condition is not satisfied, the XRA generates a warning (for small deviations) or error message (for large deviations) in the upstream connector state, along with a recommendation to help you remedy the situation. Notes
|