
Troubleshooting negative latencies
| Introduction | Latency is the time a packet takes to travel from source to destination. Hence, seeing negative latency values in the report is always a surprise, it's as if packets arrived even before they were sent! The figure below is one such example. This article explains how this is possible and what actions can be taken to prevent it.
|

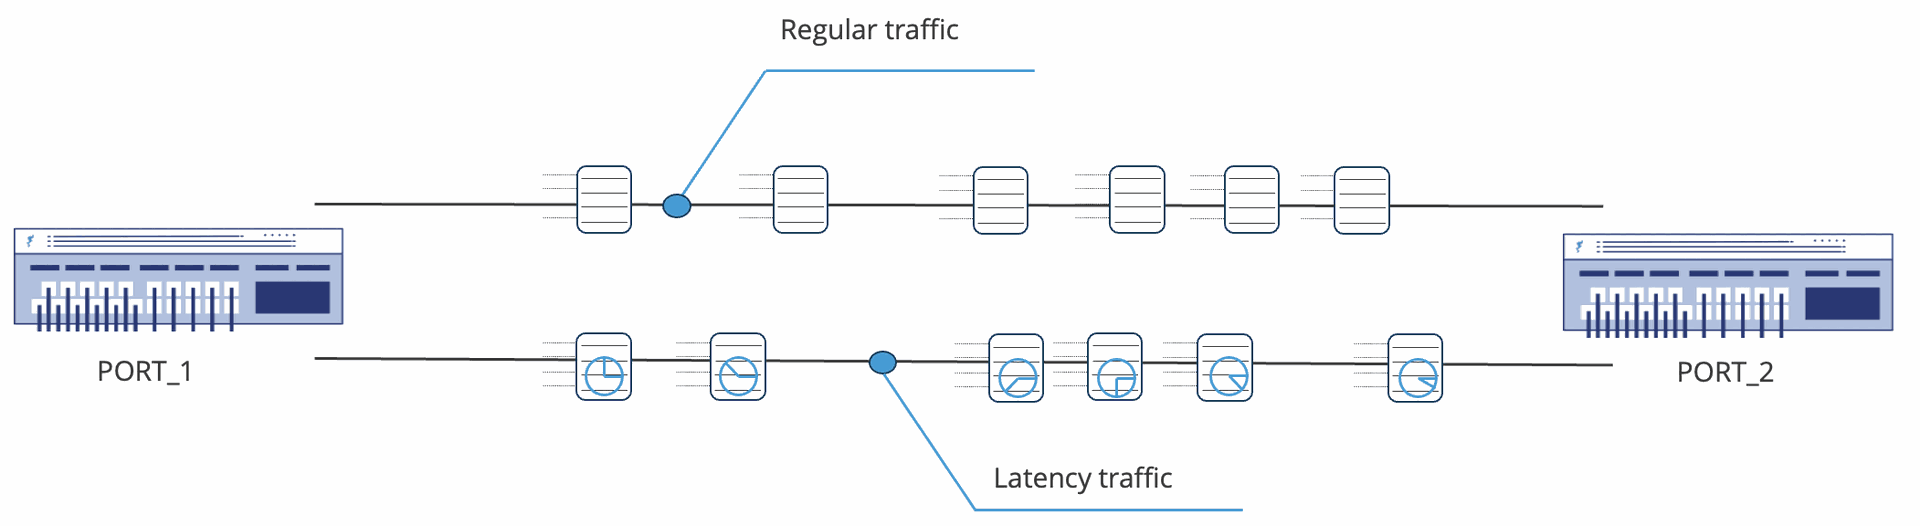
| Measuring latency with ByteBlower | The picture below shows two FrameBlasting flows. The one at the top is a regular flow with packets going from PORT_1 to PORT_2, the one at the bottom is a latency flow. Contrary to the regular flow, the ByteBlower server will modify traffic for the latency flow! Part of the payload content is replaced with a real-time timestamp. This value represents the moment the packet leaves the ByteBlower, so the current local time at the source ByteBlower port. The receiving ByteBlower port only needs to inspect the packet and compare the timestamp in the packet to its current time. The difference (local time at the destination/receiver ByteBlower port minus the timestamp value in the packet) represents how long the packet was in transit, i.e. the latency of the packet. The advantage of this approach is that the only communication between PORT_1 and PORT_2 is through the test traffic itself, no other protocols are needed. The ports don't have to be on the same interface, same server, or even in the same lab.
The above approach is used both by ByteBlower servers and Wireless Endpoints. All information is available in the traffic itself. This makes it very flexible to measure the latency between ports docked to the same server, between a server and Wireless Endpoint, or between different ByteBlower servers. Since we rely on local clocks on the ports to generate and compare the timestamps, and since the timestamps are carried in the packet payload, there are two major reasons for problems with measuring latency:
We'll have a look at both problems in more detail. |
| Synchronized clocks | In the section above we've explained how the transmitting side adds a timestamp to the frames The receiving end compares this value to its local time. We expect to measure a difference between the value in the frame and the time at the receiving end, this is how long the packet was underway. Hence the clocks need to be synchronized, otherwise, we're just measuring the difference in clocks rather than the packet transit time. Clock differences where the receiver port's clock trails the sender port's clock are the major cause of negative latency values! |
| Within the same ByteBlower server | Not a problem here, since the source and destination port use the same clock! If the setup allows you to, using a single ByteBlower server is the preferred way to measure latency! |
| Between two ByteBlower servers | As mentioned above both ByteBlowers needs to be time-synced. The article below offers more info on how to configure this: 📄 Physical connection with a Meeting Point Note that for latency measures, it is important to keep the clocks of the different ByteBlower servers in sync (using NTP or PTP), since otherwise they can drift away from each other. If you only sync them once, the first measurement can give good latency results, but repeating that same test a couple of months later could provide wrong results.
|

| Between a ByteBlower server and the ByteBlower Endpoint | Measuring latency using a ByteBlower Endpoint is a challenge. Contrary to regular ByteBlower traffic, here it is not a ByteBlower server port that sends or receives traffic, but it's the ByteBlower Endpoint (your phone e.g.). Key question: which timestamp to use? When registering with a Meeting Point, the Wireless Endpoint synchronizes its local time to the Meeting Point's time (the latter takes the time of the ByteBlower server it is connected to). Important to note that this time synchronization is not as good as two ByteBlower servers using the same NTP server! Whereas the ByteBlower servers can use a (typically stable) management network to synchronize, the Wireless Endpoint uses the same connection as the traffic itself if not configured to use a separate management interface. Furthermore, there is no update of time synchronization during a test, so a Wireless Endpoint moving from one AP to another AP during a test could experience a severe time drift without its clock being updated. Bottom line: latency measures for a Wireless Endpoint are provided as a best-effort service. Be careful when interpreting these results! |
| Packet corruption | Since the timestamps are carried in the packet payload, there is another reason latency measurements can go wrong: corrupted packets. The most likely to happen in the case of a corrupted packet is:
Below is an example of such a latency measurement (simulated through an impairment node).
Next to the obvious spikes in latency, you can have a look at the packet loss measurements to know whether or not the negative latency was caused by packet corruption. To solve these problems, you will need to solve the packet corruption itself (network or device). |

| Other cases? | If your tests match none of the above cases, then it's a good idea to contact us at support.byteblower@excentis.com. We'll help you further from there. |