
GUI: TCP flow direction, duration, and throughput
| Introduction | In the ByteBlower GUI, the user does not configure HTTP clients and servers directly. Instead, the user defines a TCP flow in the Flow View, whose traffic flows between a source port and a destination port. |
| TCP flow direction (configuration) | Note that in the background, an HTTP client and HTTP server are still created. Based on the HTTP Request Method field in the TCP Flow Template view (AUTO, GET, or PUT), the client and server are created on the correct port. This ensures the bulk of data flows from the configured source port to the destination port. Consider two ports HTTP server and HTTP client.
|
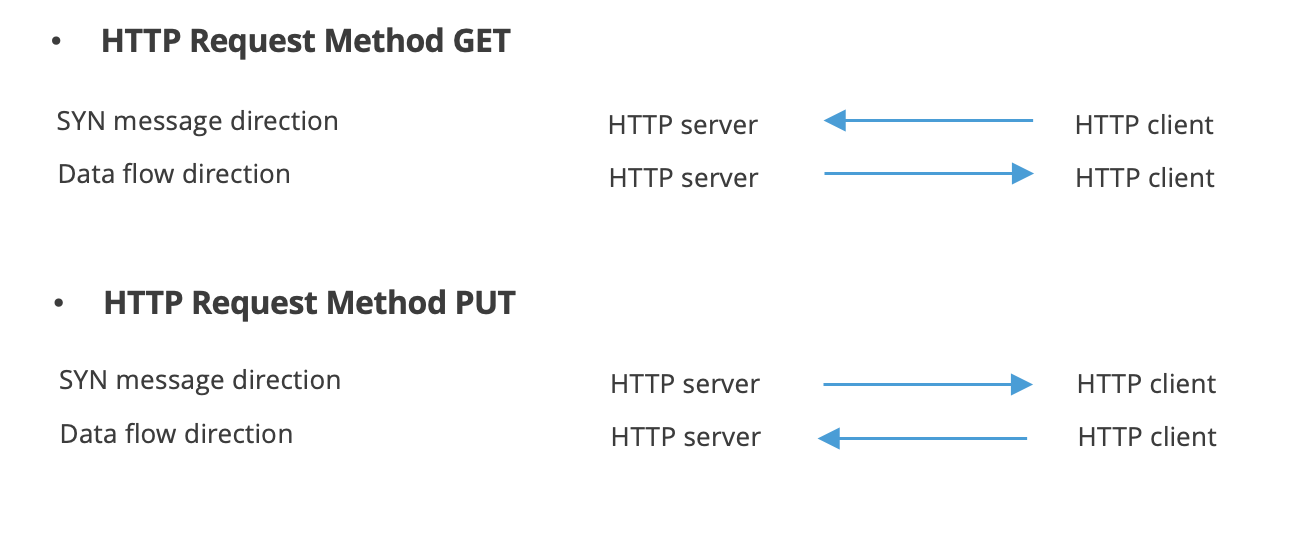
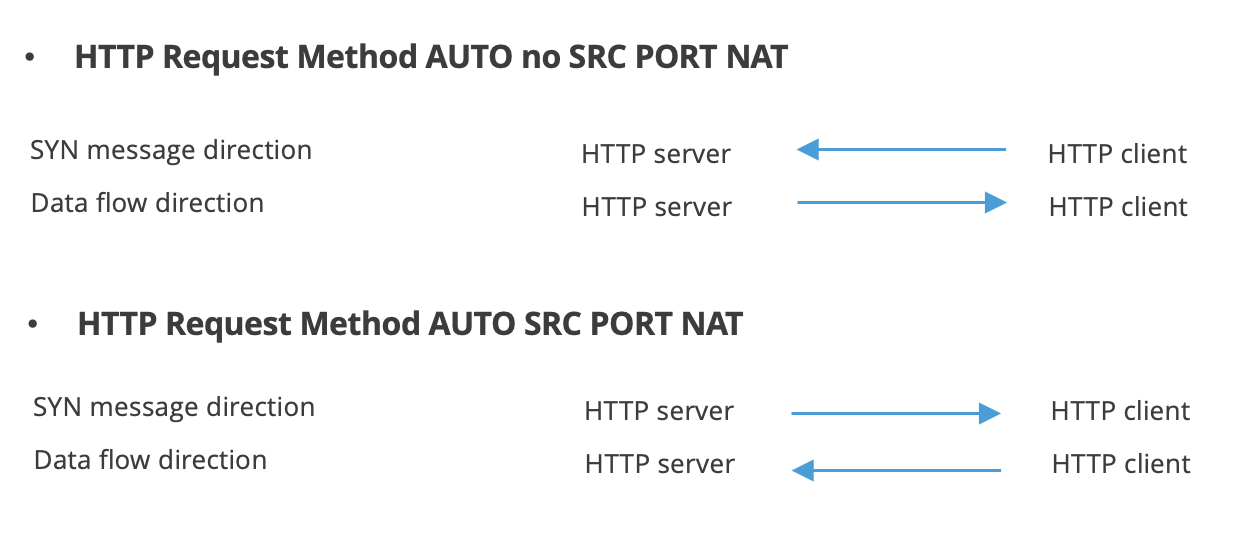
| AUTO direction | The default case (AUTO) normally results in the GET situation. However, if the configured source port is a NATted port (as configured in the Port view), GET is likely not to work. In this case, the SYN message would flow from the destination port towards the source port. If the source port is behind a NATbox however, it will typically drop that SYN message. That's why ByteBlower switches to PUT in that case. |
| TCP duration and throughput (report) | In the report, the duration and average throughput results are presented to the user. Their values are based on the API calls described above.
This results in the following formulas:
In addition, the report also includes more detailed Timing information. An example is shown below.
The above statistics are over the whole lifetime of the TCP flow. Intermediate results are shown in the TCP graphs. An example is shown below, more information about this graph is available in this KB article.
|

