Background: Interpreting and using TCP flow timing information
Posted by Tim De Backer, Last modified by Pieter Vandercammen on 05 October 2022 11:43 AM

Introduction

This article explains the timing information available from the ByteBlower. In particular, the focus is on the TCP. To provide a realist network-load, we'll use HTTP on top of this protocol. As will be shown below, only a small subset of the HTTP features are necessary to test the network in both directions. The relevant background for TCP and HTTP will be detailed throughout the text.

As a brief introduction, for most, HTTP is the popular protocol to deliver the customer with web-pages. Simplified, an HTTP client will request a web page or file stored on an HTTP server. In the next sections we'll call this the "GET" request. The reverse direction is supported by a "PUT" request. Here, again, the HTTP client uploads data to the server. To transport these commands and payload, it relies on a lower layer TCP. It is this layer that guarantees for HTTP to reliably exchange information between end-points. Unlike it's sister protocol UDP, TCP is session oriented. As we will detail below, setting up such a session requires a number of messages to be exchanged back and forth. As can be expected, in networks with high latencies, this introduces noticeable delay. With the ByteBlower, one is able to instrument such a TCP session at various steps in its lifetime and tune the parameters for optimal results.

Although the focus of this article is on TCP, we will start with a brief introduction on HTTP.  It allows us to explain the server-client model. As will be noted, the direction into which the bulk of the data flows depends on the request asked over HTTP.  Almost immediately, we will expand this information into a flow-diagram of the associated TCP session. Subsequent sections provide significantly more detail, they will expand the edge-cases and focus on the retrieving this information through the API.

HTTP and TCP session timing

Web traffic provides a realistic load for testing the TCP performance of a network setup. HTTP is designed around a client-server model. In abstract it is reasonably simple: the client asks a request to a public server, the second answers with a response. For our purposes we'll work with two types: "GET" and "PUT" requests. This essential HTTP implementation is sufficient for our purpose, to measure the TCP performance.

  • In "GET" requests, the client asks the server for the contents a particular network location. Such a request contains a brief header. The payload, or the contents is answered by the HTTP server.
  • The "PUT" request is a mirror of the above. Here the client asks the server to place data at a particular, virtual location. The client will attach the contents immediately to its request. The response of the server will be brief.

Although, neither is particularly difficult for our applications, at times they are reason for confusion: in some aspects the requests are nearly similar, in others they are diametrically opposed. Throughout the document, we'll keep highlighting the point of interest for that particular section. This will the text easy to follow.

Continuing with HTTP, all requests need following three items:

  • an HTTP client on the one port
    • initiates the TCP session
  • an HTTP server on the other port
      responds to the TCP session
  • a scheduled HTTP request on the HTTP client
    • is sent from client to server at the desired time
    • to which the server responds with an HTTP response

In brief, all requests are initiated from the a private client toward a public server. This initial message is short and text-based. We'll call a request large when the amount of data it refers to is large. When asked a GET message, the server responds with the requested binary data. In the 'PUT' type, the HTTP client will append the provided data directly onto the request. In the ByteBlower server, the data is generated at runtime and requires no configuration from the user. For our purposes, the specific content of the 'GET' and 'PUT' requests outside the scope of this article.

To highlight the differences between both request types, we'll itemize them below:
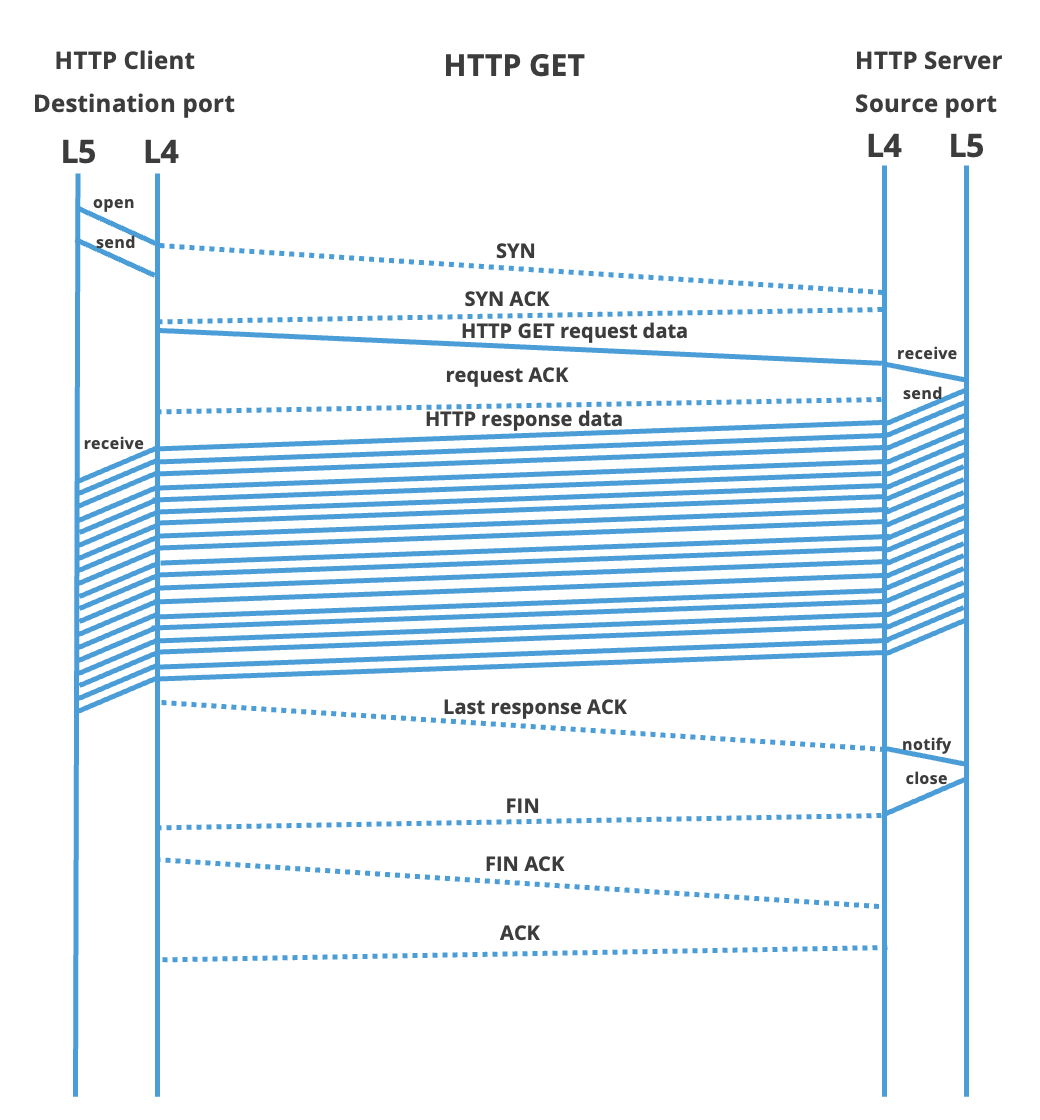
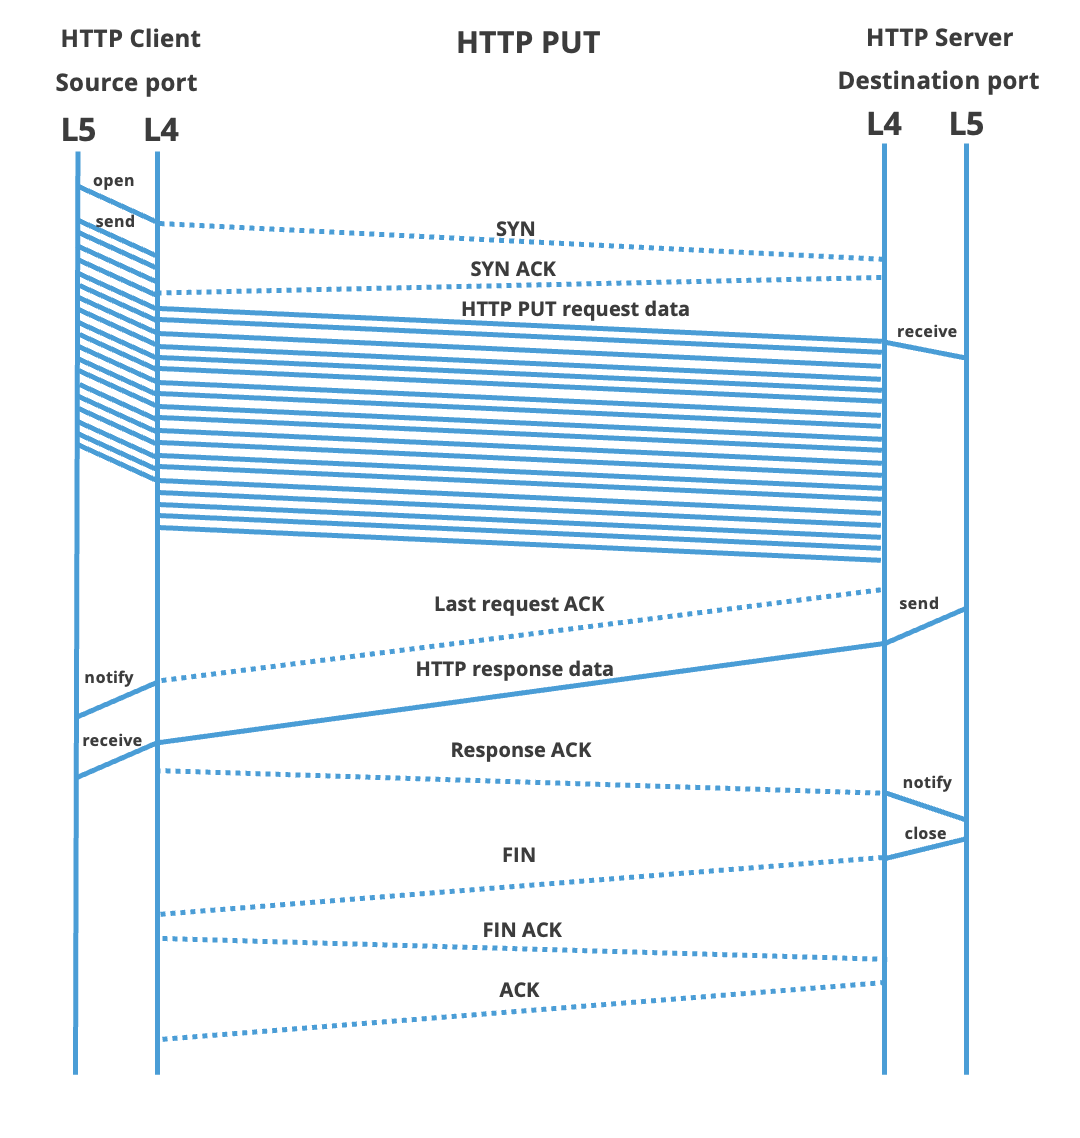
  • HTTP GET request
    • Client requests to get data from the server.
    • HTTP request message is small.
    • HTTP response message contains the bulk of data.
    • HTTP client is the destination.
    • HTTP server is the source.
  • HTTP PUT request
    • Client requests to put data on the server.
    • HTTP request message contains the bulk of data.
    • HTTP response message is small.
    • HTTP client is the source.
    • HTTP server is the destination.

The next sections provide an overview of the lifetime of a TCP session. For now, we will assume for such a session to be well-behaving, edge-cases and exceptions are kept for the next chapter. The focus of this text is on TCP events, thus details form the above listed HTTP GET and PUT requests are kept to a minimum. As we omitted for the request, neither will we discuss the contents of the TCP messages themselves.

The server is said to open the TCP session passively: it is waiting for clients making a connection. Thus for both HTTP request types list above, the client will actively initiate the TCP session. Opening such a TCP session starts with a three-way handshake. Both client and server need to open their end of the communication and each needs to acknowledge the other end. Unlike the description might hint to, only three messages need to be exchanged. The first is a TCP message the SYN flag enabled. This is transmitted from the HTTP client to the server. The server will respond to this message with a single TCP frame with both the ACK and SYN flag enabled. This is the SYN+ACK message. In the third and final step, the TCP client acknowledges the SYN+ACK frame of the server.

When an endpoint has its outgoing SYN message acknowledged, it enters the established state. As we'll expand in the next section, one should expect for the HTTP client to enter this state before the HTTP server. End-points in this state can exchange data. Various algorithms do manage how and when a TCP frame with payload can be send across. This topic is left for other articles.

Finally, closing a TCP session follows a pattern similar to opening the connection. In the case of HTTP, the server will end the session by sending a TCP frame with a the  'FIN. The client  acknowledge this FIN flag and close its side of by also enable this flag in its response. This last fin message subsequently acknowledged by the closing end.

Putting all elements together, below one finds the communication diagram of both an HTTP GET and an HTTP PUT request. The focus is on the interaction between TCP end-points. As can be seen, both requests are nearly symmetric. The interaction between OSI layers 5 (HTTP) and layer 4 (TCP) is shown on the pair of vertical lines. Lower OSI layers (e.g. IP) are omitted to increase clarity The rest of this article explains the actions on these time-axis are actually used for TCP timing in ByteBlower:


The interesting time points on the layer 5 HTTP protocol are (in order of occurrence):

  • HTTP GET (left picture)
    • A: Initialization of the HTTP request. This starts the TCP session at layer 4.
    • D: Receiving the HTTP request at the server. This causes the server to compose the HTTP response and start sending it.
    • B: Receiving the first segment of the HTTP response message at the client.
    • C: Receiving the last segment of the HTTP response message at the client.
    • E: Acknowledgement of the last segment of the HTTP response message at the server (end of sending).
  • HTTP PUT (right picture)
    • A: Initialization of the HTTP request. This starts the TCP session at layer 4.
    • D: Receiving the first segment of the HTTP request message at the server.
    • E: Receiving the last segment of the HTTP request message at the server. This causes the server to compose the HTTP response and start sending it.
    • B: Acknowledgement of the last segment of the HTTP request message at the client (end of sending).
    • C: Receiving of the HTTP response at the client.

Each HTTP request runs through the states as shown in above diagram. The moment of transition is of course highly dependent on network load and other context. Even when multiple connections are started simultaneously one should not assume for each to run in lock-step with the others. In the sections below will focus on querying the relevant information. Multiple streams can be compared using their timestamp.

Overview

In the previous section we detailed the message exchange between both TCP end-points. The ByteBlower server will store this timing information and allow for it to be accessed through the API. We will start with the TCP events and subsequently show how to derive the HTTP events from them. Since TCP client and TCP server exchange similar messages, they use the same data structure. At the HTTP layer this symmetry is not available, we will thus list them in separate sections. As we will hint throughout these specifics, through the delay or even loss in the network either side of the TCP session will step through the transitions in the state diagram at its own pace.

The ByteBlower GUI hides even more complexity and simply returns the TCP flow duration and throughput. The final GUI section will show in detail how these results are generated.

TCP events and timestamps

As mentioned above, TCP is a session oriented protocol: a connection needs to be established before any data is exchanged between server and client. As mentioned previously, opening and closing a TCP session uses a similar three-way handshake. Because of this similarity we'll discus these events first. Next sections detail the timing-values available for an already established TCP session.  Although the next chapter focuses on HTTP, we will reuse some HTTP terminology: the TCP endpoint waiting on incoming connections will be called the [HTTP] server. The other endpoint actively opens the connections, this is the [HTTP] client. These names make this text more readable, of course TCP is used for far more than HTTP. In the next section we detail first the general concept on accessing timed events through the API. Next we'll apply these to opening and closing a TCP connection. The remainder of the section deals with events related to data-transmission.

The TCP session object are accessible through the HTTP SessionInfo objects found in the API. For both server and client, these are created once their TCP session is established. As we'll explain further in this text, it is common for  the HTTP client to be noticeable established earlier than the server. Since a server can serve multiple clients, a text-token is used to recognize a specific clients. In brief, the following code-snippets verify and fetch first the TCP session at the client and subsequently retrieve the same session at the other end.

if( [$httpClient HasSession] ) {
           set httpClientSessionInfo [ $httpClient Http.Session.Info.Get ]
           set httpClientId [ $httpClient ServerClientId.Get ]
           set tcpClientSessionInfo  [ $httpClientSessionInfo Tcp.Session.Info.Get ]
           set tcpClientResult [$tcpClientSessionInfo Result.Get ]
           $tcpClientResult Refresh
}

if( [info exists $httpClientId] && [$httpServer HasSession $httpClientId]) {
           set httpServerSessionInfo [ $httpServer Http.Session.Info.Get ]
           set tcpServerSessionInfo  [ $httpServerSessionInfo Tcp.Session.Info.Get ]
           set tcpServerResult [$tcpServerSessionInfo Result.Get ]
           $tcpServerResult Refresh
}    

The state diagram shown earlier shows and ideal behaving TCP connection. In practice, there is littel guarantee for a message to arrive at its destination. To make matters worse, there is even no guarantee for it to arrive only a single time. In addition there is a noticeable delay between transmission and reception. This strongly influences the behaviour of a TCP session. The API  exports this type of information by instrumenting both transmission and reception of specific messages. As we will show in the next section, the transmission of the initial TCP message with the SYN-flag is counted, likewise the receiving endpoint will count its arrival. For timing information, each counter is associated with a timestamp field. Both counter and timestamp are updated simultaneously. Thus the moment of last increment is available in this timestamp field. Initially, the counter has value zero. Since no event occurred, the timestamp field has no value and attempting to read it will throw a domain error. Program-code working with the API is advised to first read out the value of the counter. Only if it is larger than zero, one can also read the corresponding timestamp. These guidelines will become more clear in next sections, where we discuss the available counters and timestamps.

Establishing TCP sessions

For both HTTP client and server, their first TCP message has the SYN flag enabled. This message is part of previously described threeway handshake. In general it contains no payload and has a random sequence number. In short, we'll call it the SYN-message. The client initiates the session by sending a SYN-message to the server. The the server waits for arrival of such a SYN message and will respond a SYN+ACK message. In this last message in addition to the SYN flag, also the ACK is enabled. From an API point of view both server and client have a very similar interface. The transmission of the syn-message is counted in

  • Layer4.Tcp.ResultSnapshot.NumberOfSynSent.Get
  • Layer4.Tcp.ResultSnapshot.Timestamp.SynSent.Get

Of course this message also needs to arrive at the other end-point. Reception updates following fields:

  • Layer4.Tcp.ResultSnapshot.NumberOfSynReceived.Get
  • Layer4.Tcp.ResultSnapshot.Timestamp.SynReceived.Get

As noted previously, the server replies with a TCP message with both SYN and ACK flag enabled. This message is fully counted in the counters listed above. Since the HTTP server also acknowledges the SYN-message received from the HTTP client, it obligates the client to move to the established sate. At mentioned earlier this transition occurs only a single time. It is recorded solely in following timestamp field:

  • Layer4.Tcp.ResultSnapshot.Timestamp.Established.Get

This Established timestamp has a number important of implications. We'll briefly expand on it here. First, under ideal circumstances, the client will receive only a single SYN+ACK. In this case the SynReceived timestamp and the Established timestamp have the same value. Duplicate SYN+ACK messages are recognized by the SynReceived timestamp being larger than the Established time. The difference between timestamp.SynReceived and timestamp.Established tells exactly over which period this duplication occurred. A small measured period might hint to a misbehaving router close to the client, values larger than the retransmit time hint to lost ACK-messages. In all cases, this measurements is valuable, but needs to be interpreted for the test at hand.
Of course, comparing these timestamps is not the sole way to notice duplication: each duplicated SYN messages will also increment the NumberOfSynReceived field. A value larger than one is most certainly suspicious. Some care is necessary though, not all received and thus counted SYN-messages are valid. A NAT device along the path might corrupt sequence numbers. Such behaviour would be noted by a failed session that still managed to add up SYN-messages (.. verify..).

Finally a last remark on the Established state. As noted earlier, receiving the ACK from the HTTP client to the server is the last leg of the threeway handshake. The difference between the SynSent timestamp at the client and the Established timestamp of the server gives minimum estimate of the whole setup time of the TCP session. If multiple SYN-messages were transmitted, then this value will be a significant underestimate. Given the fairly long retransmit time of the initial SYN-message, one would expect for such behaviour to also trigger other warnings.

In summary, this section detailed the events related to opening a TCP session. We've listed five API fields to instrument this process. These are available both in the HTTP server and HTTP client. Next we've attempted to show how to use correlate these values with each other to perform more complex analysis. Most of these items will be familiar in next section where the closing a TCP is explained.

Closing TCP sessions

Closing a TCP session is similar to opening one. Both use the similar three-way handshake (<.. fourway handkshake ..>). The API is thus also very similar to the previous section. Unlike opening a TCP session, a misbehaving termination of a TCP session has little impact on the user experience (..check..). This state is thus not exported. As noted earlier, in most of the cases, the HTTP server ByteBlower will close the connection.

Enabling the FIN flag on a TCP message indicates the end of data. As the methods below show, similar to the previous section the API exports the amount of FIN-messages transmitted and received at each TCP end-point. For each type, the timestamp of the last message can be requested. It is not possible to request when the TCP session enters a closed state (or a timed wait), for the implemented HTTP requests the timestamps of the fin messages suffices here.

  • Layer4.Tcp.ResultSnapshot.NumberOfFinSent.Get
  • Layer4.Tcp.ResultSnapshot.Timestamp.FinSent.Get
  • Layer4.Tcp.ResultSnapshot.NumberOfFinReceived.Get
  • Layer4.Tcp.ResultSnapshot.Timestamp.FinReceived.Get

For most configured HTTP requests, the HTTP server will close the connection. A duration based PUT request is the exception here, the HTTP client will initiate closing the TCP connection. In this last case, no repsonse from the HTTP server follows. This action is perfectly valid at the TCP layer, but from the HTTP protocols point of of view, this action can be understood as the client abruptly breaking the connection. To keep matters simple, we'll ignore this edge-case for and assume for the HTTP server always sending out a response and subsequently closing the connection.

Established TCP connections

A session operation offers quite a number of measurements. Solely for completeness, we'll mention the timestamps available from the API. Even though not strictly a timestep, we'll briefly expand on the roundtrip measurements.

All result objects in the ByteBlower API are associated with a timestamp. This timestamp is the start of the measurement period. The value is a multiple of the interval duration.

  • Layer4.Tcp.ResultSnapshot::Timestamp.Get

For a TCP session in operation, one is able to fetch the timestamps of the last received and last transmitted packet within the snapshot. For the cumulative snapshot of a finished flow, this will the very last received packets of the session. The interval updates offer such a sample once every snapshot duration, thus default once every second. When directly comparing this timestamp to the previously listed types, the last packet snapshot will of course be fairly close to the snapshot boundary. Finally, more timestamps values can be obtained by running an RX capture stream in the ByteBlower ports at the TCP end-points. (see..). Nonetheless, this last packet

  • Tx.Timestamp.Last.Get
  • Rx.Timestamp.Last.Get

Directly comparing timestamps of HTTP server with client is not recommended. Especially in high-latency, high throughput links at any moment a significant number of packets will still be in flight. There is thus little guarantee for the last transmitted packet at the source to be the same as the last received packet at the drain. At better approach is to use the roundtrip time, which we'll describe in the next section.

The TCP stack will measure the roundtrip time continuously. It's calculation is based on RFC <..>. In brief, any TCP stack needs to keep track of unacknowledged packets. Lost segments need to be retransmited after a brief period. For frames that do manage to be acknowledged, on can calculate the time it took for ACK to arrive. As described further in the RFC, one can't of course user every packet for the roundtrip time calculation. The API exports the results of this calculation through following methods. Unlike the time tag fields, the current value is returned. In part because of the measurement approach, estimating the average latency would be highly biased and often give an incorrect impression.

  • Layer4.Tcp.ResultSnapshot::RoundTripTime.Minimum.Get
  • Layer4.Tcp.ResultSnapshot::RoundTripTime.Current.Get
  • Layer4.Tcp.ResultSnapshot::RoundTripTime.Maximum.Get

HTTP timestamps

At the HTTP layer, a number of timestamps are available. Since this is a higher layer protocol,

At the HTTP layer, Layer5.Http.ResultData class exports the measured test results. Both interval and cumulative results can be obtained by accessing the resulthistory the session objects. The example below fetches the resulthistory and refreshes it to the version stored in the ByteBlower server. Both Interval and Cumulative history are accessible through a very similar way, we show both. In addition both use the same class.  In the example, the latest cumulative snapshot is requested explicitly, the IntervalSnapshots are returned as a list. With the exception of very brief tests, this list will only contain the last snapshots. It is intended to offer a reasonable window to process the snapshots. Finally, to keep the example brief, no such processing is done on either snapshot.

set httpClientResultHistory [ $httpClientSessionInfo Result.History.Get ]
$httpClientResultHistory Refresh
if [$httpClientResultHistory Cumulative.Length.Get  > 0 ]{
       set cumulative [$httpClientResultHistory Cumulative.Length.Get]
}
set intervalList [$httpClientResultHistory Interval.Get]

The HTTP Result data exports the timestamps of the first and last received frames. For the cumulative data, this is measured over the whole flow. The interval snapshot, keeps track of the data received within the particular snapshot. These timestamps are calculated based on the source timestamps of the TCP messages explained earlier. Nonetheless, since HTTP is a higher layer protocol, not all TCP frames directly be forwarded and this relationship is somewhat complicated. For instance, the TCP frames establishing and closing the connection are not counted, this is solely exists at the lower layers. To complicate matters even further, TCP frames might be received out of order (e.g. due to packet-loss). Thus as a suggestion it is not advised to compare packet-for-packet across OSI layers. In the next section we'll focus on a number of comparisons that can be easily done. As will be noted, the HTTP request type will play major role here.

Before continuing with the interaction of the HTTP request methods, we'll detail the API methods first. For each endpoint, one is able to request the timestamp of the first and last HTTP packet received or transmitted. Thus a total of eight parameters are measured. As will be shown below, even for very long requests, a number of these will have the exact same value.

  • Layer5.Http.ResultData::Rx.Timestamp.First.Get
  • Layer5.Http.ResultData::Tx.Timestamp.First.Get
  • Layer5.Http.ResultData::Rx.Timestamp.Last.Get
  • Layer5.Http.ResultData::Tx.Timestamp.Last.Get

As mentioned earlier, the HTTP client is always the originator of the HTTP request. A client can either request to receive a large amount of data from the server ("GET") or it can transmit a lot of data to the server ("PUT"). type of the request determines in which direction the main amount data will flow.

Client/Server Request type

  HTTP GET HTTP PUT
HTTP Client brief request DATA
HTTP Server DATA brief response

A first point of interest is the setup-time. within this article we'll call this the time necessary between starting the TCP request and the first outgoing HTTP data packet. This time uses the established time already mentioned in the previous section. The type of HTTP request will play a major role here. In all cases, the client will initiate the process by asking a request from the server. In GET-type of request, this request will be brief. The bulk of the traffic is subsequently in the response of the HTTP server. This bears the question on what value should be used for the setup time. The first data packet of the server will only be responded to after has the TCP connection to the server is established and and the HTTP client did send it's response to the server. This thus counts significant overhead, but on the other hand, a real user fetching a webpage will need to wait a similar amount of time before receiving his first page.

The HTTP PUT requests operates similarly, but the bulk of the data flows in the other direction : the HTTP client includes a large file for the server in its request. The responds with a brief answer. For similar sized data transmission, the PUT request will thus to take less time then a GET request. Especially for small requests, this difference can be significant.

The throughput at the HTTP layer is calculated as the time between first HTTP data-packet and the last. Ignoring edge-cases, the majority of the data will be either received or transmitted at an instance. This method will take into account the request type and whether the parent is Client or Server. For very small payloads, this measurement will be strongly dominated by roundtrip time, choosen HTTP request method rather than the capacity of the link.

Client/Server Request type

  HTTP GET HTTP PUT
HTTP Client RXbytes TXbytes
HTTP Server TXbytes RXbytes


HTTP Get  Client  Server HTTP PUT  Client  Server
AverageThroughput.Get  RXbytes / (Last - First) TXbytes / (Firs - T2) AverageThroughput.Get TXbytes / (T2 - T1) RXbytes / (T2 - T1)
Server: timestamps T1, T2 and T3

The ByteBlower server maintains timing information using no more than three simple timestamp values: T1, T2 and T3.

The content of those values is defined in the table below and described in more detail below. Note that T1 < T2 < T3.

HTTP GET  Client  Server HTTP PUT  Client  Server
T1 A D T1 A D
T2 B D' T2 B E
T3 C E T3 C E'
  • HTTP GET (left picture)
    • Client
      • T1 (A): When the HTTP request is prepared and before it is pushed asynchronously down to layer 4 (causing the TCP session to be initialized), this timestamp is recorded.
      • T2 (B): When the first segment of the HTTP response arrives at the HTTP client (on layer 5), this timestamp is recorded.
      • T3 (C): For each segment of the HTTP response that arrives at the HTTP client (on layer 5), this timestamp is updated. When all data is transferred, this will be located at position C.
    • Server
      • T1 (D): When the first (and probably only) segment of a new HTTP request arrives at the HTTP server (on layer 5), this timestamp is recorded.
      • T2 (D'): Immediatly after the HTTP response is sent down to layer 4, this timestamp is recorded. This is typically very close to T1.
      • T3 (E): When the complete HTTP response is acknowledged to be transferred to the client, the HTTP server (on layer 5) is notified and this timestamp is recorded.
  • HTTP PUT (right picture)
    • Client
      • T1 (A): When the HTTP request is prepared and before it is pushed down to layer 4 (causing the TCP session to be initialized), this timestamp is recorded.
      • T2 (B): When the complete HTTP request is acknowledged to be transferred to the server, the HTTP client (on layer 5) is notified and this timestamp is recorded.
      • T3 (C): When the first (and probably only) segment of the HTTP response arrives at the HTTP client (on layer 5), this timestamp is recorded.
    • Server
      • T1 (D): When the first segment of a new HTTP request arrives at the HTTP server (on layer 5), this timestamp is recorded.
      • T2 (E): For each segment of the HTTP request that arrives at the HTTP server (on layer 5), this timestamp is updated. When all data is transferred, this will be located at position E.
      • T3 (E'): Immediatly after the HTTP response is sent down to layer 4, this timestamp is recorded. This is typically very close to the final value of T2.

API: hiding the complexity

The T1, T2 and T3 values can be retrieved from the HTTP.SessionInfo object. This real-time status object should always be refreshed first. It then takes a snapshot from the ByteBlower server and makes sure you get the latest timestamp values. The API calls are:

  • T1.Get
  • T2.Get
  • T3.Get

Because the meaning of the server values T1, T2 and T3 is different in different situations, using them is error-prone. To hide this complexity, the ByteBlower API offers more intuitive wrapper methods around these values. The wrappers are:

  • Time.Request.Start.Get
  • Time.Request.Packet.First.Get
  • Time.Request.Packet.Last.Get
  • Time.Response.Start.Get
  • Time.Response.Packet.First.Get
  • Time.Response.Packet.First.Get
  • Time.Data.Packet.First.Get
  • Time.Data.Packet.Last.Get

Both the availability of the result and the result value of these calls still depends on the situation (GET or PUT, client or server). Their values are explained in the table below:

HTTP Get  Client  Server HTTP PUT  Cient  Server
Time.Request.Start.Get T1 (A) N/A Time.Request.Start.Get T1 (A) N/A
Time.Request.Packet.First.Get N/A T1 (D) Time.Request.Packet.First.Get N/A T1 (D)
Time.Request.Packet.Last.Get N/A N/A Time.Request.Packet.Last.Get T2 (B) T2 (E)
Time.Response.Start.Get N/A T1 (D) Time.Response.Start.Get N/A T3 (E')
Time.Response.Packet.First.Get T2 (B) T2 (D') Time.Response.Packet.First.Get T3 (C) N/A
Time.Response.Packet.Last.Get T3 (C) T3 (E) Time.Response.Packet.First.Get N/A N/A
Time.Data.Packet.First.Get T2 (B) T2 (D') Time.Data.Packet.First.Get T1 (A) T1 (D)
Time.Data.Packet.Last.Get T3 (C) T3 (E) Time.Data.Packet.Last.Get T2 (B) T2 (E)

Notice that the Time.Data.Packet.First value on a HTTP client using PUT is an approximation! The Time.Request.Start value (A) is used because the Time.Request.Packet.First value is not available.

Finally, there is an average throughput API call:

  • AverageThroughput.Get

This value is calculated using the first and last data packet timestamps, or in other words:

HTTP Get  Client  Server HTTP PUT  Client  Server
AverageThroughput.Get  RXbytes / (T3 - T2) TXbytes / (T3 - T2) AverageThroughput.Get TXbytes / (T2 - T1) RXbytes / (T2 - T1)

Notice that the throughput value on a client using HTTP PUT is an approximation! For maximum accuracy, always try to measure the throughput on the receiving side!

GUI: TCP flow direction, duration and throughput

In the ByteBlower GUI, the user does not configure HTTP clients and servers directly. Instead the user defines a TCP flow in the Flow View, whose traffic flows between a source port and a destination port.

TCP flow direction (configuration)

Note that in the background, a HTTP client and HTTP server are still created. Based on the HTTP Request Method field in the TCP Flow Template view (AUTO, GET or PUT), the client and server are created on the correct port. This ensures the bulk of data flows from the configured source port to the destination port.

Consider two ports SRC_PORT and DST_PORT.

  • HTTP Request Method GET
    Configured port SRC_PORT   DST_PORT
    Created HTTP application HTTP server   HTTP client
    SYN message direction   <<<<<<<  
    Data flow direction   >>>>>>>  
  • HTTP Request Method PUT
    Configured port SRC_PORT   DST_PORT
    Created HTTP application HTTP client   HTTP server
    SYN message direction   >>>>>>>  
    Data flow direction   >>>>>>>  

The default case (AUTO) normally results into the GET situation. However, if the configured source port is a NATted port (as configured in the Port view), GET is likely not to work. In thic case, the SYN message would flows from the destination port towards the source port. If the source port is behind a NATbox however, it will typically drop that SYN message. That's why ByteBlower switches to PUT in that case.

  • HTTP Request Method AUTO
    no SRC_PORT NAT
    Configured port SRC_PORT   DST_PORT
    Created HTTP application HTTP server   HTTP client
    SYN message direction   <<<<<<<  
    Data flow direction   >>>>>>>  
  • HTTP Request Method AUTO
    SRC_PORT NAT
    Configured port SRC_PORT   DST_PORT
    Created HTTP application HTTP client   HTTP server
    SYN message direction   >>>>>>>  
    Data flow direction   >>>>>>>  

TCP duration and throughput (report)

In the report, the duration and average throughput results are presented to the user. Their values are based on the API calls described above.

  • Timing and throughput values are always measured at the receiving side. This is the HTTP client for GET and the HTTP server for PUT.
  • Duration is based on Time.Data.Packet.First and Time.Data.Packet.Last.
  • Throughput is based on AverageThroughput.

This results in the following formula's:

  Duration formula Throughput formula
GET T3 - T2 (C-B) ClientRXbytes / duration
PUT T2 - T1 (E-D) ServerRXbytes / duration

In addition, the report also includes more detailed Timing information. An example is shown below.

  • Time To First Byte (TTF): Is the time it takes for the first TCP payload byte to reach the client. This matches the T2 timestamps mentioned earlier.
  • Minimum RTT: Is the shortest round-trip time throughout the lifetime of the session.
  • Average RTT: The average round-trip time throughout, again over the whole lifetime of the TCP session.
  • Maximum RTT: Finally the longest round-trip time encountered during the session.

The above statistics are over the whole lifetime of the TCP flow. Intermediate results are shown in the TCP graphs. An example is shown below, more information about this graph is available in this KB article.

(1 vote(s))
Helpful
Not helpful

Comments (2)
Brooks Matt
23 April 2014 07:44 PM
Can you define more clearly what duration consists of?
Tim De Backer
15 May 2014 01:55 PM
In the GUI we use a single HTTP request-response pair to simulate TCP traffic. The TCP flow duration is calculated as the time between the arrival of the first and last *data* byte.

This means the TCP connection establishment, the HTTP message not carrying data, and TCP connection shutdown are *not* taken into account.

Either the HTTP request (PUT requests) or HTTP response (GET requests) may act as data message. The total size of this data message is <size> bytes, where <size> is the number of bytes specified in the TCP Flow Template view.

The GUI makes sure the data message is sent towards the destination port configured in the Flow View. It does this by running either the HTTP client (GET request) or the HTTP server (PUT request) on that destination port.

To visualise this, see the C-B range on the image for GET and the E-D range for PUT.

We to help you!