Capturing traffic with ByteBlower
| Introduction | When you are testing your device with ByteBlower, you sometimes like to have a pcap-capture of the data for debugging purposes. With the ByteBlower API we can easily capture that network traffic and present it to you as a pcap-file. But this is as easy with the ByteBlower GUI. This feature will help you to debug quickly the problem with your device. Let me explain how to do this! |
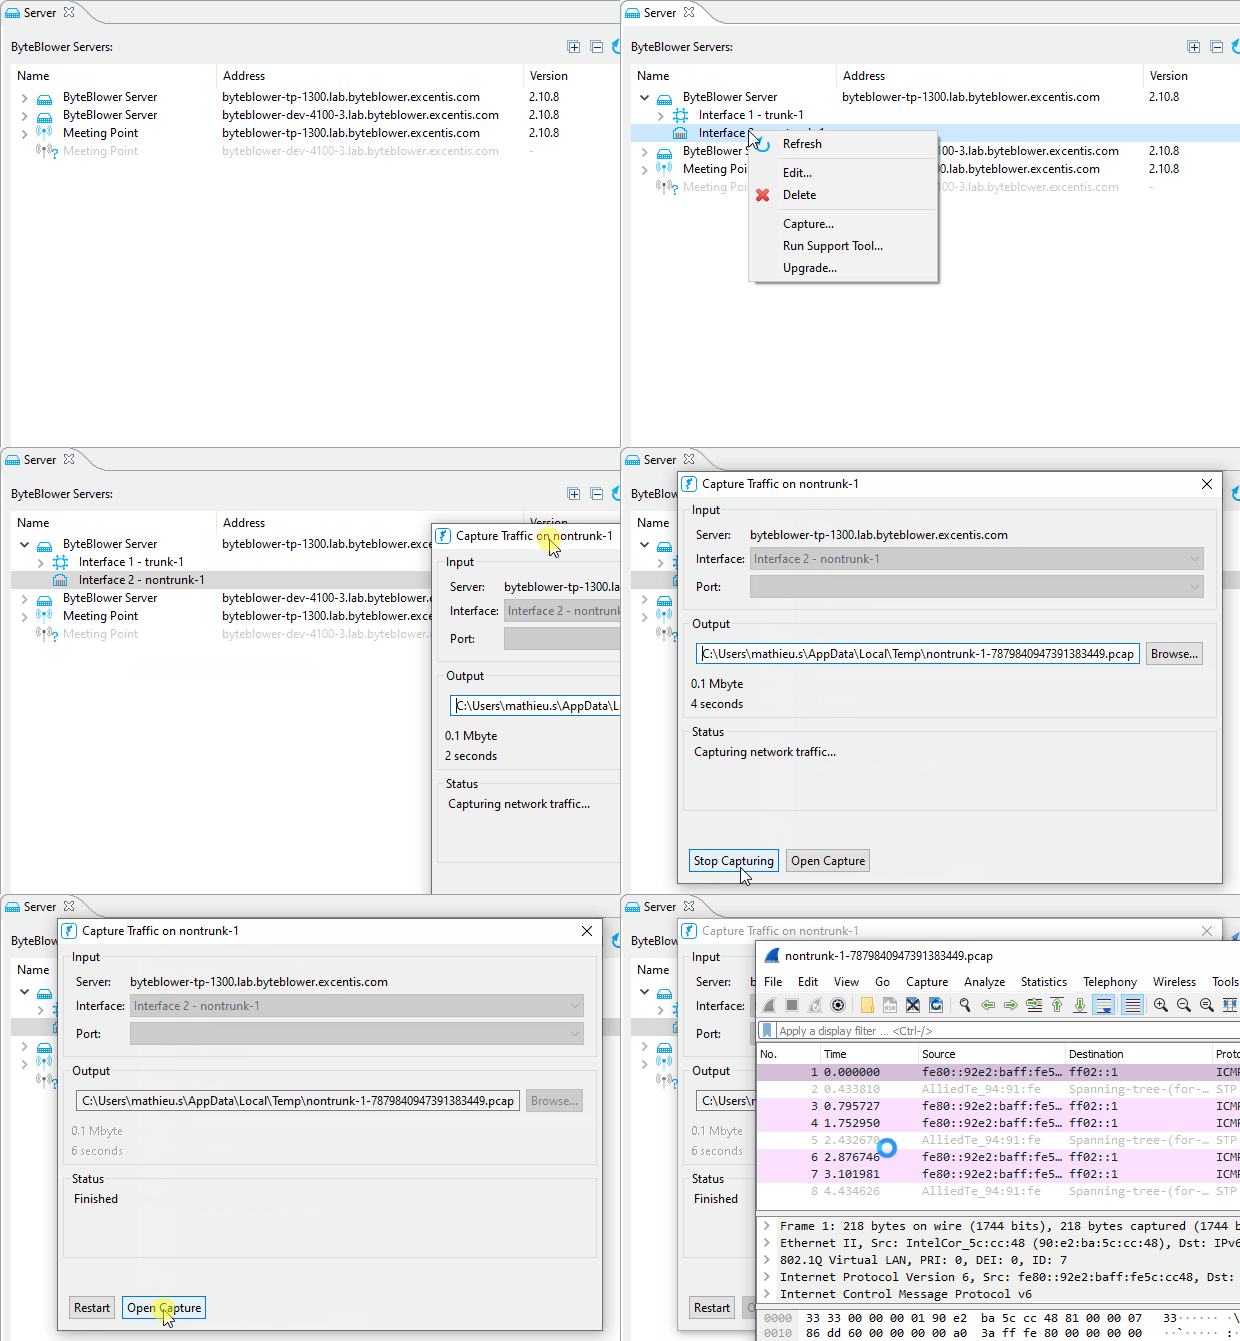
| Using the ByteBlower GUI | This is the simplest way of capturing traffic. Available since GUI v2.11, and server v2.9. Here you can see how it works:
|
| Options to keep the file size manageable. | With the default settings, all network traffic is captured from the selected interface. Often this results in very large PCAP files. Since version 2.13 of the ByteBlower GUI, two options are open to reduce file size:
The default setting for both is to capture all traffic. These two options are available in the advanced config part of the capture dialog. They are configured before the capture starts. Did the capture already begin? The options become editable again in dialog after stopping the capture. |
| Using the ByteBlower capture tool | This was the easiest way of capturing traffic on your port until we brought the capture functionality to the GUI. It's a command-line tool that can be downloaded from the setup pages. It can be used on Windows, Mac, and Linux. Note:This tool only works on ByteBlower Server running 2.1 and higher. |
